Assessment Report and Reflection

Timeline of Core Course Assessment
Each semester that a Core Course is taught, the instructor or course coordinator record and collect assessment data in line with the course's assessment plan. At the end of the semester, the assessment report process begins. Here is a rough outline of the steps the University Core Curriculum office currently follows to process your assessment data into a report:- At the end of the semester, each course/section sends in their collected assessment data (see here for a downloadable example of the preferred data format) or the data is collected directly from D2L rubrics or assignment grades, in line with a course's assessment plan.
- You will receive an email at the beginning and end of each semester you teach a CORE course, to remind you about collecting and sending in your assessment data.
- If we have questions about your emailed data, or are unable to collect your data from D2L, the UCC office with email you in the following semester to clarify you assessment plan or data.
- If you are unsure what is in your course's assessment plan, or need to update your plan due to a change in course curriculum, please email corecurr@siu.edu and we can send you a copy of your plan or help you update it.
- The UCC office then takes your assessment data and converts them into score on a 1-5 scale (with a Note Evaluated-NE option), so we can compare Learning Objective scores across courses and across time. These scores roughly align to a F-A grading scale, with NE indicating a student did not complete the assessment assignment(s).
- We then turn your data into an interactive excel report (see Assessment Report and Reflection Tools and Examples below) using each students' scores and demographic information provided by the university. These reports are useful for you in a few ways (see Why do these assessment reports matter to me? below):
- Easy-to-read format
- Compare scores and grades across semesters or between sections
- Look at potential patterns among student learning
- Evaluate areas of improvement for high-risk students
- Once your interactive assessment report is ready (usually 1-2 semesters), we will send your report back to you and answer any questions you may have.
- We encourage you to examine your report and reflect on how your course went, your students' learning, and if there is anything you want to change about your course or assessment, based on your data and course expectations.
- If you would like a guided run-through of the notable features in your report or instructions on how to work various features of the report (like slicers), please email UCC staff at the UCC office (corecurr@siu.edu).
- Lastly, the Higher Learning Commission (HLC) requires that we collect a short (0.5-1 page) reflection on what you find relevant out of the assessment report and if you plan to make any changes to your course based on what you found. Tips for writing the reflection can be found under Assessment Report and Reflection Tools and Examples below.
- We then file away your reflection and record a portion of your assessment data in a separate document for the Higher Learning Commission (HLC).
Example of Core Course Assessment
Watch Here for a Breakdown of a sample UCC Assessment Report and Potential ways to Interpret it.
Frequently Asked Q&A's
Assessment Report and Reflection Tools and Examples
Assessment Reports
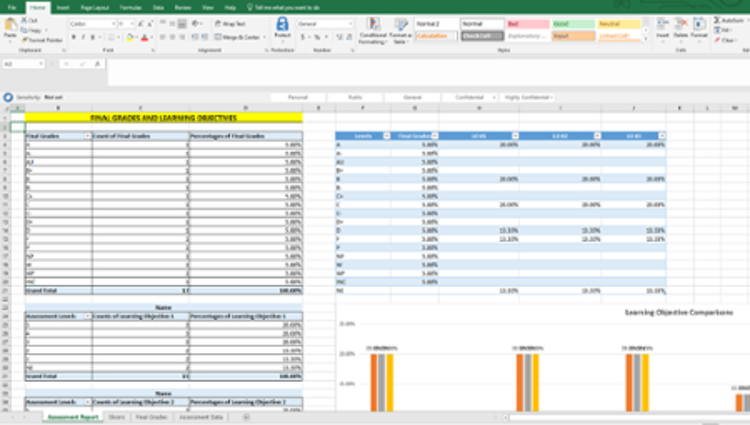
Below is an example of our interactive assessment report, using fake data.
Example Interactive Assessment Report (.xls)
Note, this example report only contains data for 1 semester. Typically, if a course is offered multiple ties using the same assessment plan, it will contain data for multiple semesters, allowing longitudinal comparison.
Example Interactive Assessment Report (.xls) - Includes Pass/No Pass Grading
Note, due to the COVID-19 pandemic, Southern Illinois University, Carbondale allowed students to choose a pass-no pass option for final grades. Since this grading option was not available for past semesters, a new report format is being used to include a more detailed breakdown of final grade options. There are no changes to the format of Learning Objective scores or other demographic information.
Reflections
Tips sheet for writing your reflection
Tips for Completing the UCC Reflection Document (.doc)
If you have any questions about your assessment report or writing your reflection, please do not hesitate to contact UCC staff at corecurr@siu.edu.
I'm a new instructor: How do I see my assessment plan?
If this is the first time your course is being taught for CORE credits (or first time within the past 4-5 years), then you will need to complete a new assessment plan, based on how you plan to run and evaluate your course. Learn more about completing an assessment plan.
If you think there may be an existing assessment plan for your course, please email UCC staff at corecurr@siu.edu for a copy of your plan.
Why do these assessment reports matter to me?
While the assessment data is collected as a requirement of the Higher Learning Commission (HLC), the interactive assessment reports made with the data are for the instructor's benefit and course improvement. We highly encourage you to look through your assessment report, ask questions, and consider if the learning objective scores and final grades match the expectations held for the students in your course - and if not, what could be improved?
Here are some of the advantages of using the assessment report to evaluate your course:
- Easy-to-read format allows you to compare multiple sets of information at once, to look for patterns amongst your students and assignments.
- You can compare scores and grades across semesters or between sections. This may be helpful in comparing the teaching effectiveness of different lecturers or TAs, or in seeing if a new teaching style is benefiting your student’s learning.
- Look at potential patterns among student learning:
- The reports contain standardized Learning Objective scores (for multiple semesters, in some courses), the final grades for every student in the course, and student demographic information like gender, ethnicity, year classification (freshman, sophomore, etc.), college, major, admission year, high school GPA, ACT composite and Science scores, and class section.
- This lets you ask questions about how different types of students are doing in your course, using the report's Slicers feature
- How are grades and Learning Objective levels distributed in my course - a normal curve? all highly-successful or poor? a bimodal distribution where half excel and half do terribly?
- Are men and women doing equally well learning the course Learning Objectives? What about newer students versus older students?
- How do related-majors and non-related-majors compare in final grades and Learning Objectives?
- Evaluate areas of improvement for high-risk students. You may find some types of students consistently perform poorer than other types of students, and may benefit from additional help or a different teaching style. These reports can help you watch for systematic patterns and make changes to your course to help all students succeed in your course. Some potential questions you may ask:
- Are minority students routinely getting lower Learning Objective scores or final grades in the course than non-minority students?
- Are freshmen and sophomores failing to learn in your course where older classifications succeed (maybe more prerequisites are needed)?
- Are women doing comparatively well in STEM courses, particularly when enrollment in low?
- Are first-generation students doing comparatively well in Learning Objectives and final grades? What about students with low High School GPAs?
- The reports offer you a chance to reflect on your teaching style, assignments, and what your students are learning in the course. While these reports cannot adequately measure all of the benefits and take-aways from a course, they can offer an objective peek into some of the objectives a student should learn from completing a college-level course.
How do I do the reflection on my assessment reports?
Once you receive back your interactive assessment report (about 1-2 semesters after the target semester), we ask you to write a short (0.5-1 page) reflection on what you find relevant out of the assessment report and if you plan to make any changes to your course based on what you found. Reflections should be returned within one semester of receiving your interactive report back, though earlier is greatly preferred (easier for both the instructors and the UCC office!).
For tips on how to write the UCC reflection document, see the tab "Assessment Report and Reflection Tools", above.
How do I use Slicers in my interactive assessment report?
To look at a specific demographic breakdown in your students (such as how those who earned A's did vs those who earned C's, or only the latest semester or your specific section), click on the ‘Slicers’ tab at the bottom of the Assessment Report excel sheet, and then click on the button(s) of the subgroup you want to look at (like "A" under the Grade table or “201960” under the Academic Period table). This will filter the data on the front tab (named "Assessment Report") to only show the data from those designations of students. You can also click on the little symbol of multiple checkmarks to choose multiple slicer options in a table. When you look at the front tab now, the grades and Learning Objective scores will be from only the students in the group(s) you chose. The slicer's page will leave options for what other classifications are available among the group you chose (e.g., of the students who earned B's, you can further break it down into White versus Black/African American students). To remove the filter and reset the dataset, click on the symbol of a filter with a red X in the upper right corner of various slicer tables. This will reset the slicer page and front page to the full dataset again. Sometimes after using slicers, the order of the grade/Learning Objective breakdowns on the front page will be scrambled. To put them back in order, go to the table and find the small light gray box with a down-arrow in the first column, on the upper left corner. Click the button, and select ‘A to Z’ or ‘Z to A’ to reorder the table to whichever format you prefer.
Note: Academic Periods are the available semesters of data to look through. If only one semester's data is in the report, only 1 option will be present. If multiple semesters are included, you can choose to narrow down results to only specific semesters. Use the following guide: the first 4 numbers are the year, and the last two are the semester (20 for spring, 40 for summer, 60 for fall). Ex, 201960 is data for Fall 2019.
In addition, if you would like a live walkthrough of using the slicers, we would be happy to show you through a short Zoom or phone meeting, and go step-by-step using the slicers and interpreting the results. Please set up a meeting by emailing UCC staff (GA in charge of assessment) at corecurr@siu.edu.